
Optimising checkout is one of the highest-leverage levers for D2C brands, yet it is often approached with guesswork rather than structured experimentation. Small changes — button copy, layout tweaks, progress indicators, or payment options — can yield outsized conversion gains, but without rigorous testing, it is impossible to know what truly works.
This blog, Checkout experiments: a step-by-step A/B testing framework for conversion uplift, provides a practical framework for running checkout experiments that are both methodical and actionable.
It guides teams on how to define hypotheses, structure tests, segment users, and measure results, ensuring that changes to the checkout flow reliably increase conversions rather than introducing friction or confusion.
Why structured checkout experiments outperform intuition
Conversion uplift comes from testing, not guesswork
The limits of anecdotal optimisations
Many teams make changes based on opinions, competitor benchmarks, or “what feels better.” While these can sometimes improve metrics, they rarely scale reliably. Intuition-driven tweaks do not account for differences in customer segments, device types, or regional behaviours — all of which materially affect checkout performance in India.
Operational consequences of untested changes
Unvalidated changes can reduce conversion rates, create friction, or trigger support tickets. For example, changing a button label without testing could confuse repeat users or affect payment success rates. Systematic A/B testing prevents such regressions by measuring outcomes before a full rollout.
Benefits of a repeatable testing framework
A structured framework allows teams to iterate safely and consistently. Each test becomes a data point, building a knowledge base over time. This reduces risk while accelerating learning, creating compounding conversion gains rather than one-off successes.
Example impact
Brands that standardise test design, hypothesis formation, and measurement see faster insights, fewer false positives, and confidence in scaling winning variants across geographies and SKUs.
Defining hypotheses and success metrics
Clear objectives guide meaningful experiments
Formulating testable hypotheses
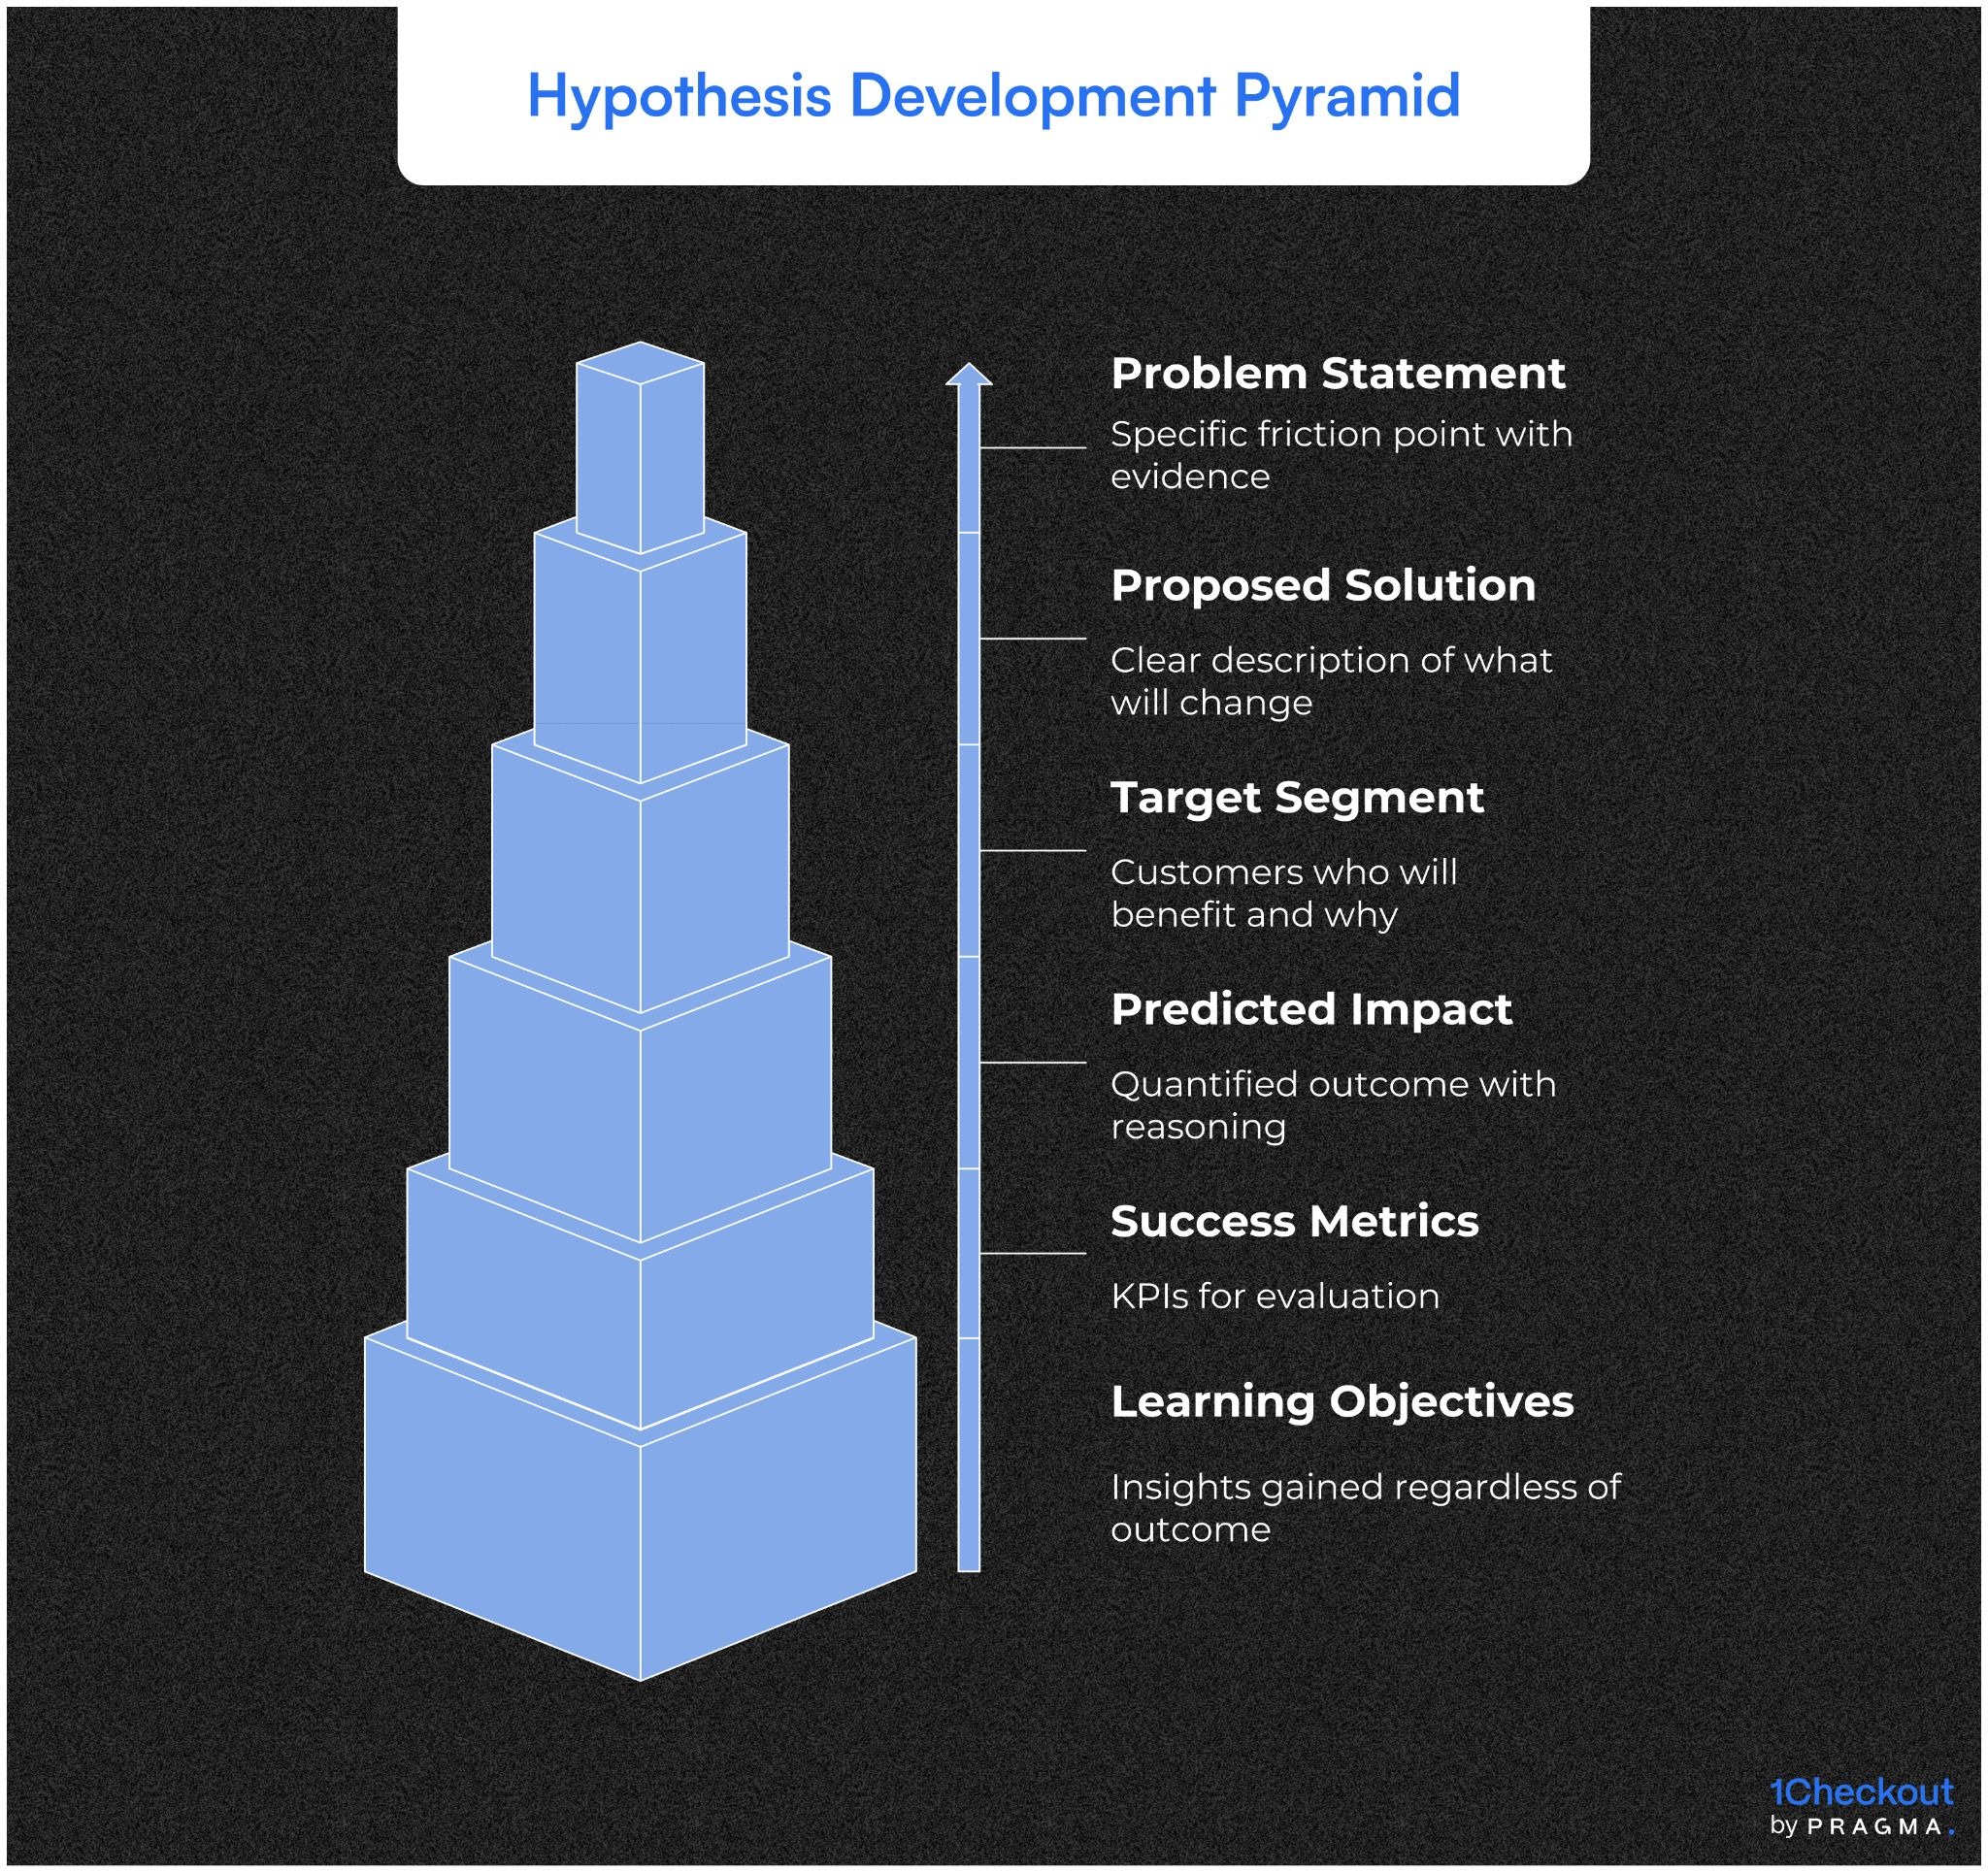
A good hypothesis connects a specific change to an expected outcome. For checkout, this might involve modifying layout, copy, payment options, or progress indicators. Each hypothesis must be measurable and falsifiable, so teams know whether the change actually drives improvement.
Operationalising hypotheses
Document each hypothesis with expected uplift, affected segments, and KPI targets. This ensures that product, marketing, and ops teams are aligned on what constitutes a “success” before any test begins.
Choosing primary and secondary metrics
Primary metrics typically focus on conversion (completed checkout, payment success), while secondary metrics track engagement, drop-offs, and support queries. Clear metric definition prevents ambiguous interpretations after the experiment concludes.
Example metrics in practice
- Primary: Checkout completion rate
- Secondary: Cart abandonment, payment errors, coupon usage, customer support tickets
This combination ensures insights are both actionable and operationally safe.
How do you prioritise checkout experiments effectively?
Not all tests deserve equal attention — prioritisation determines ROI
One of the biggest bottlenecks in experimentation is not execution, but deciding what to test first. Without prioritisation, teams waste cycles on low-impact ideas while ignoring high-friction areas.
Using a prioritisation framework
A simple scoring model ensures objectivity:
- Impact: Expected effect on conversion or revenue
- Confidence: Strength of hypothesis based on data or past tests
- Ease: Effort required (engineering, design, ops)
This helps teams rank experiments instead of relying on instinct.
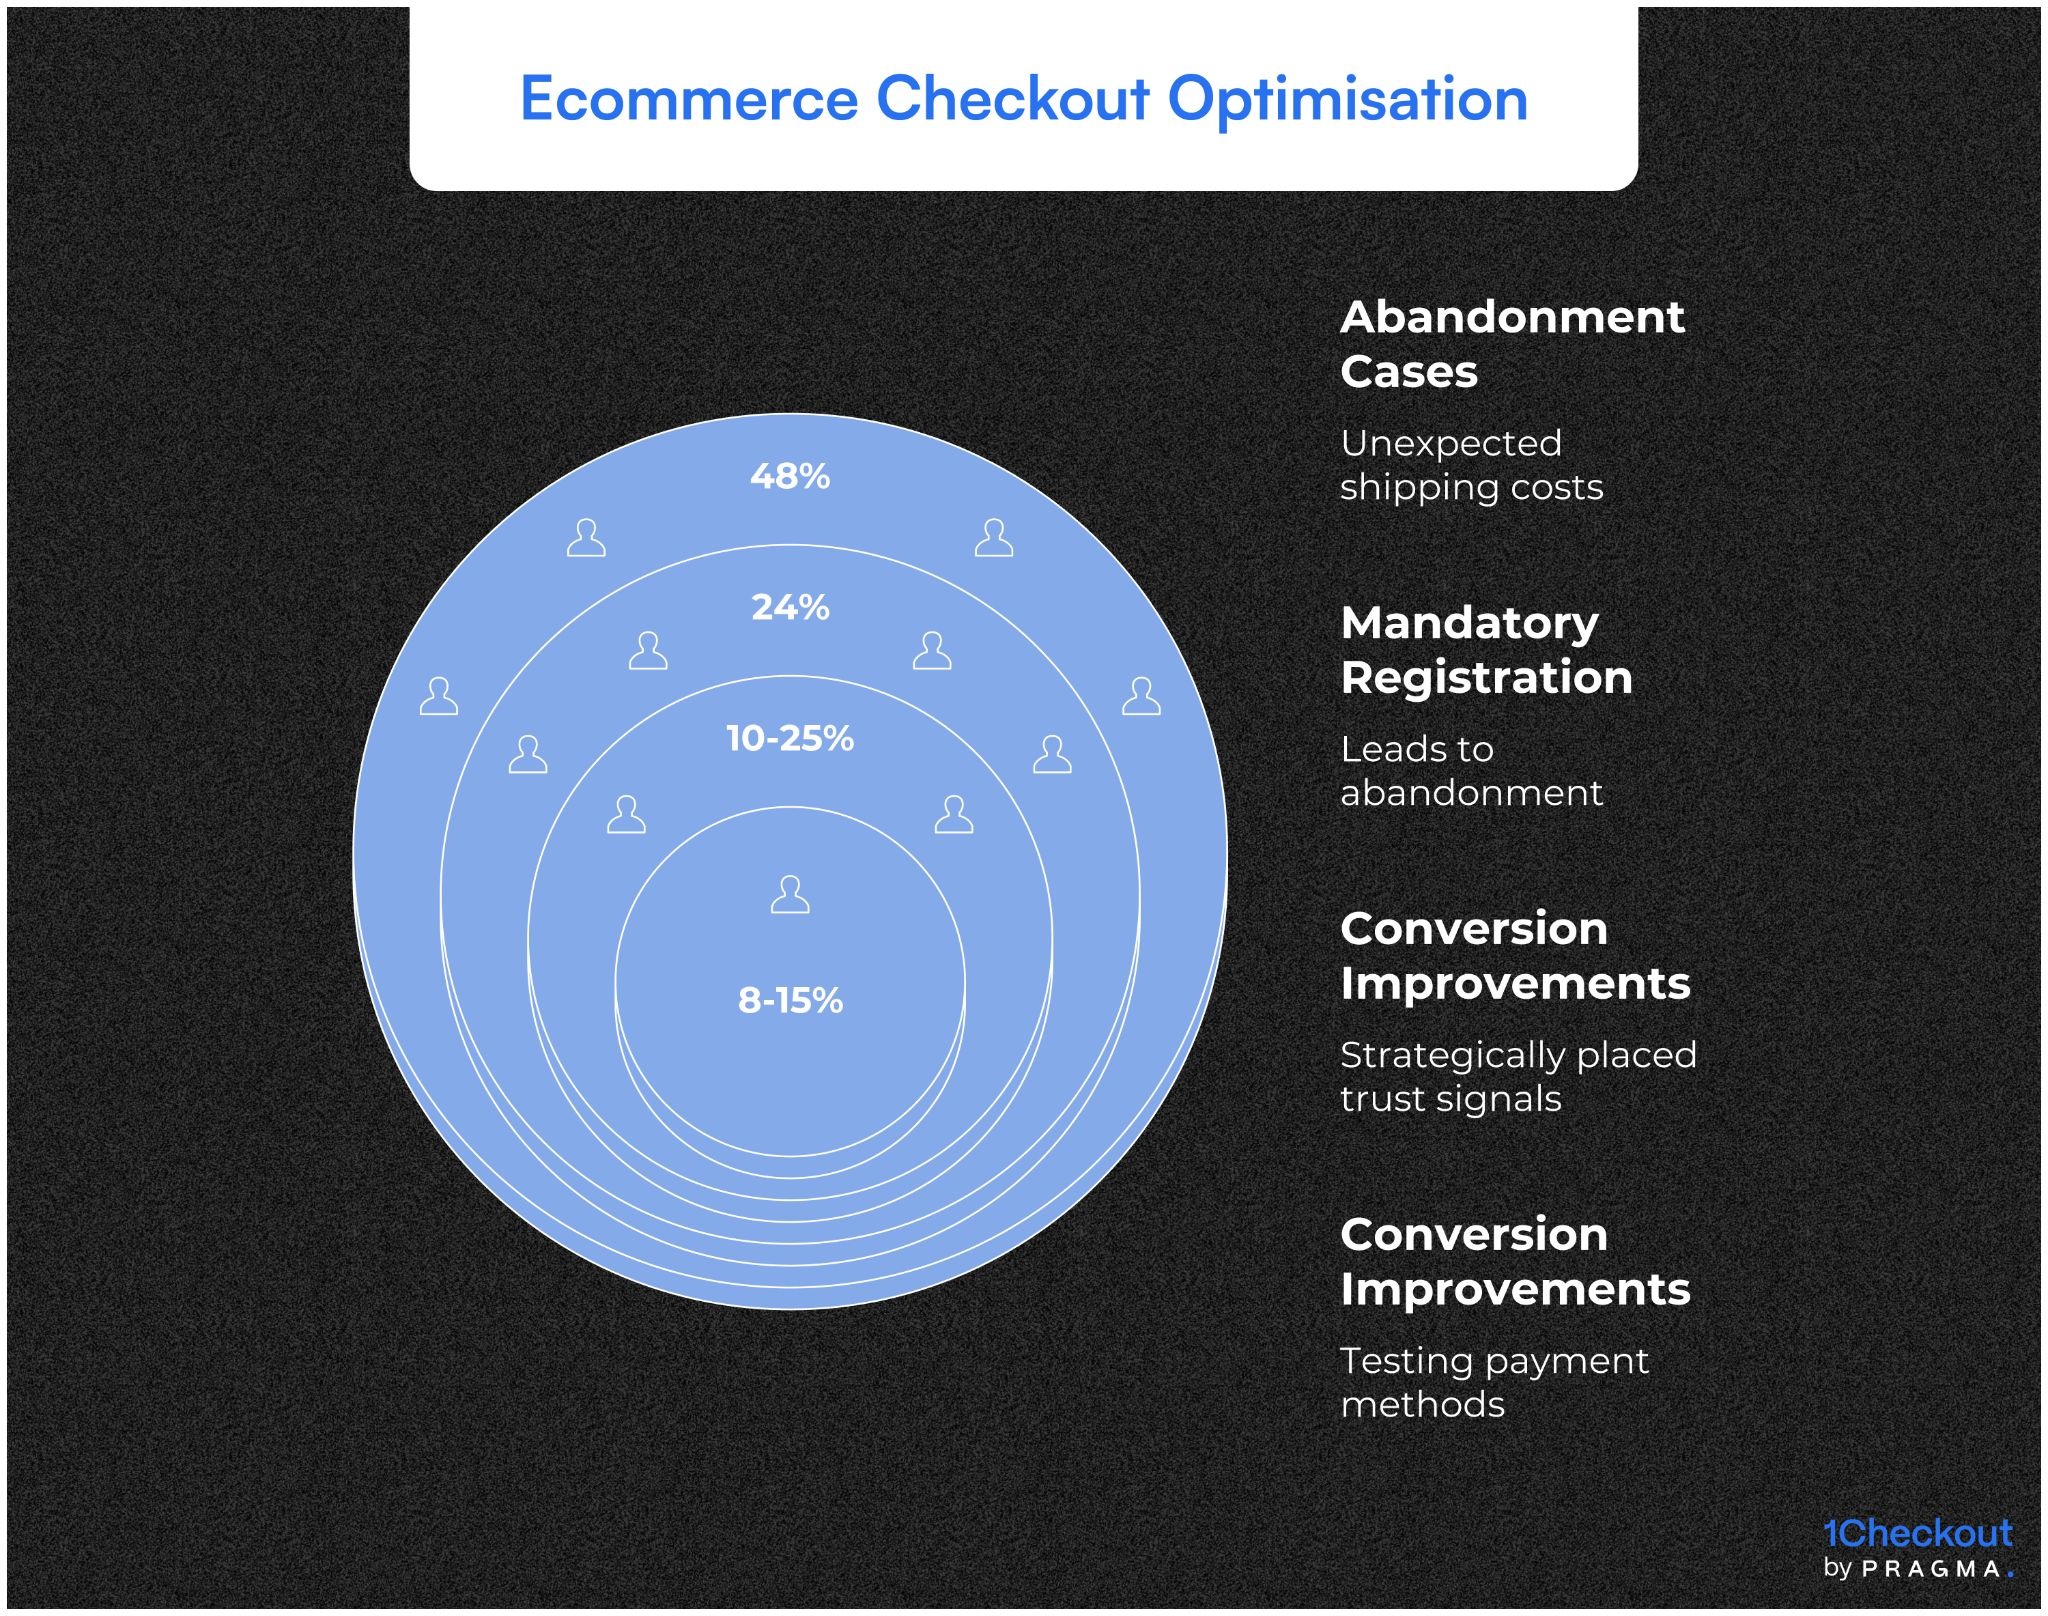
Identifying high-impact zones in checkout
Focus on areas where drop-offs are highest:
- Payment step failures
- Address form completion
- Coupon application friction
- COD vs prepaid decision points
These stages typically deliver maximum uplift per experiment.
Operational takeaway
Prioritisation ensures that experimentation velocity translates into business outcomes — not just activity.
What are common A/B testing mistakes in checkout?
Avoiding these pitfalls is as important as running the tests themselves
Even structured experimentation can fail if execution is flawed.
Running tests without sufficient sample size
Premature conclusions often lead to false positives. Many teams stop tests early after seeing initial uplift, which rarely sustains.
Ignoring segment-level performance
Aggregate results can hide critical insights.
A variant may:
- Improve mobile conversion
- But reduce desktop performance
Without segmentation, this nuance is lost.
Overlapping experiments
Running multiple tests on the same checkout flow can distort results. Changes may interact, making it impossible to isolate impact.
Chasing insignificant uplifts
Not every statistically significant result is worth implementing. Small gains without operational relevance create noise, not value.
Operational takeaway
The cost of incorrect conclusions is often higher than the cost of not testing at all.
Traffic allocation and experiment design
Randomisation and statistical rigour underpin reliable results
Determining sample size
Sufficient sample size is critical to detect meaningful differences. Too small a sample yields inconclusive results, while too large a sample risks unnecessarily exposing more customers to potential friction. Sample size calculations should consider expected effect size, baseline conversion, and desired confidence level.
Operational approach
Use historical traffic and conversion data to simulate expected outcomes. Allocate traffic randomly but ensure balanced distribution across segments, devices, and regions.
Avoiding cross-contamination
Customers interacting with multiple devices or campaigns can skew results if not controlled. Proper randomisation ensures that variants remain isolated, and outcome measurement remains unbiased.
Example solution
- Assign unique user IDs for test allocation
- Ensure repeat sessions see the same variant
- Exclude overlapping campaigns from influencing results
Core elements to test in checkout
Prioritisation ensures effort aligns with potential impact
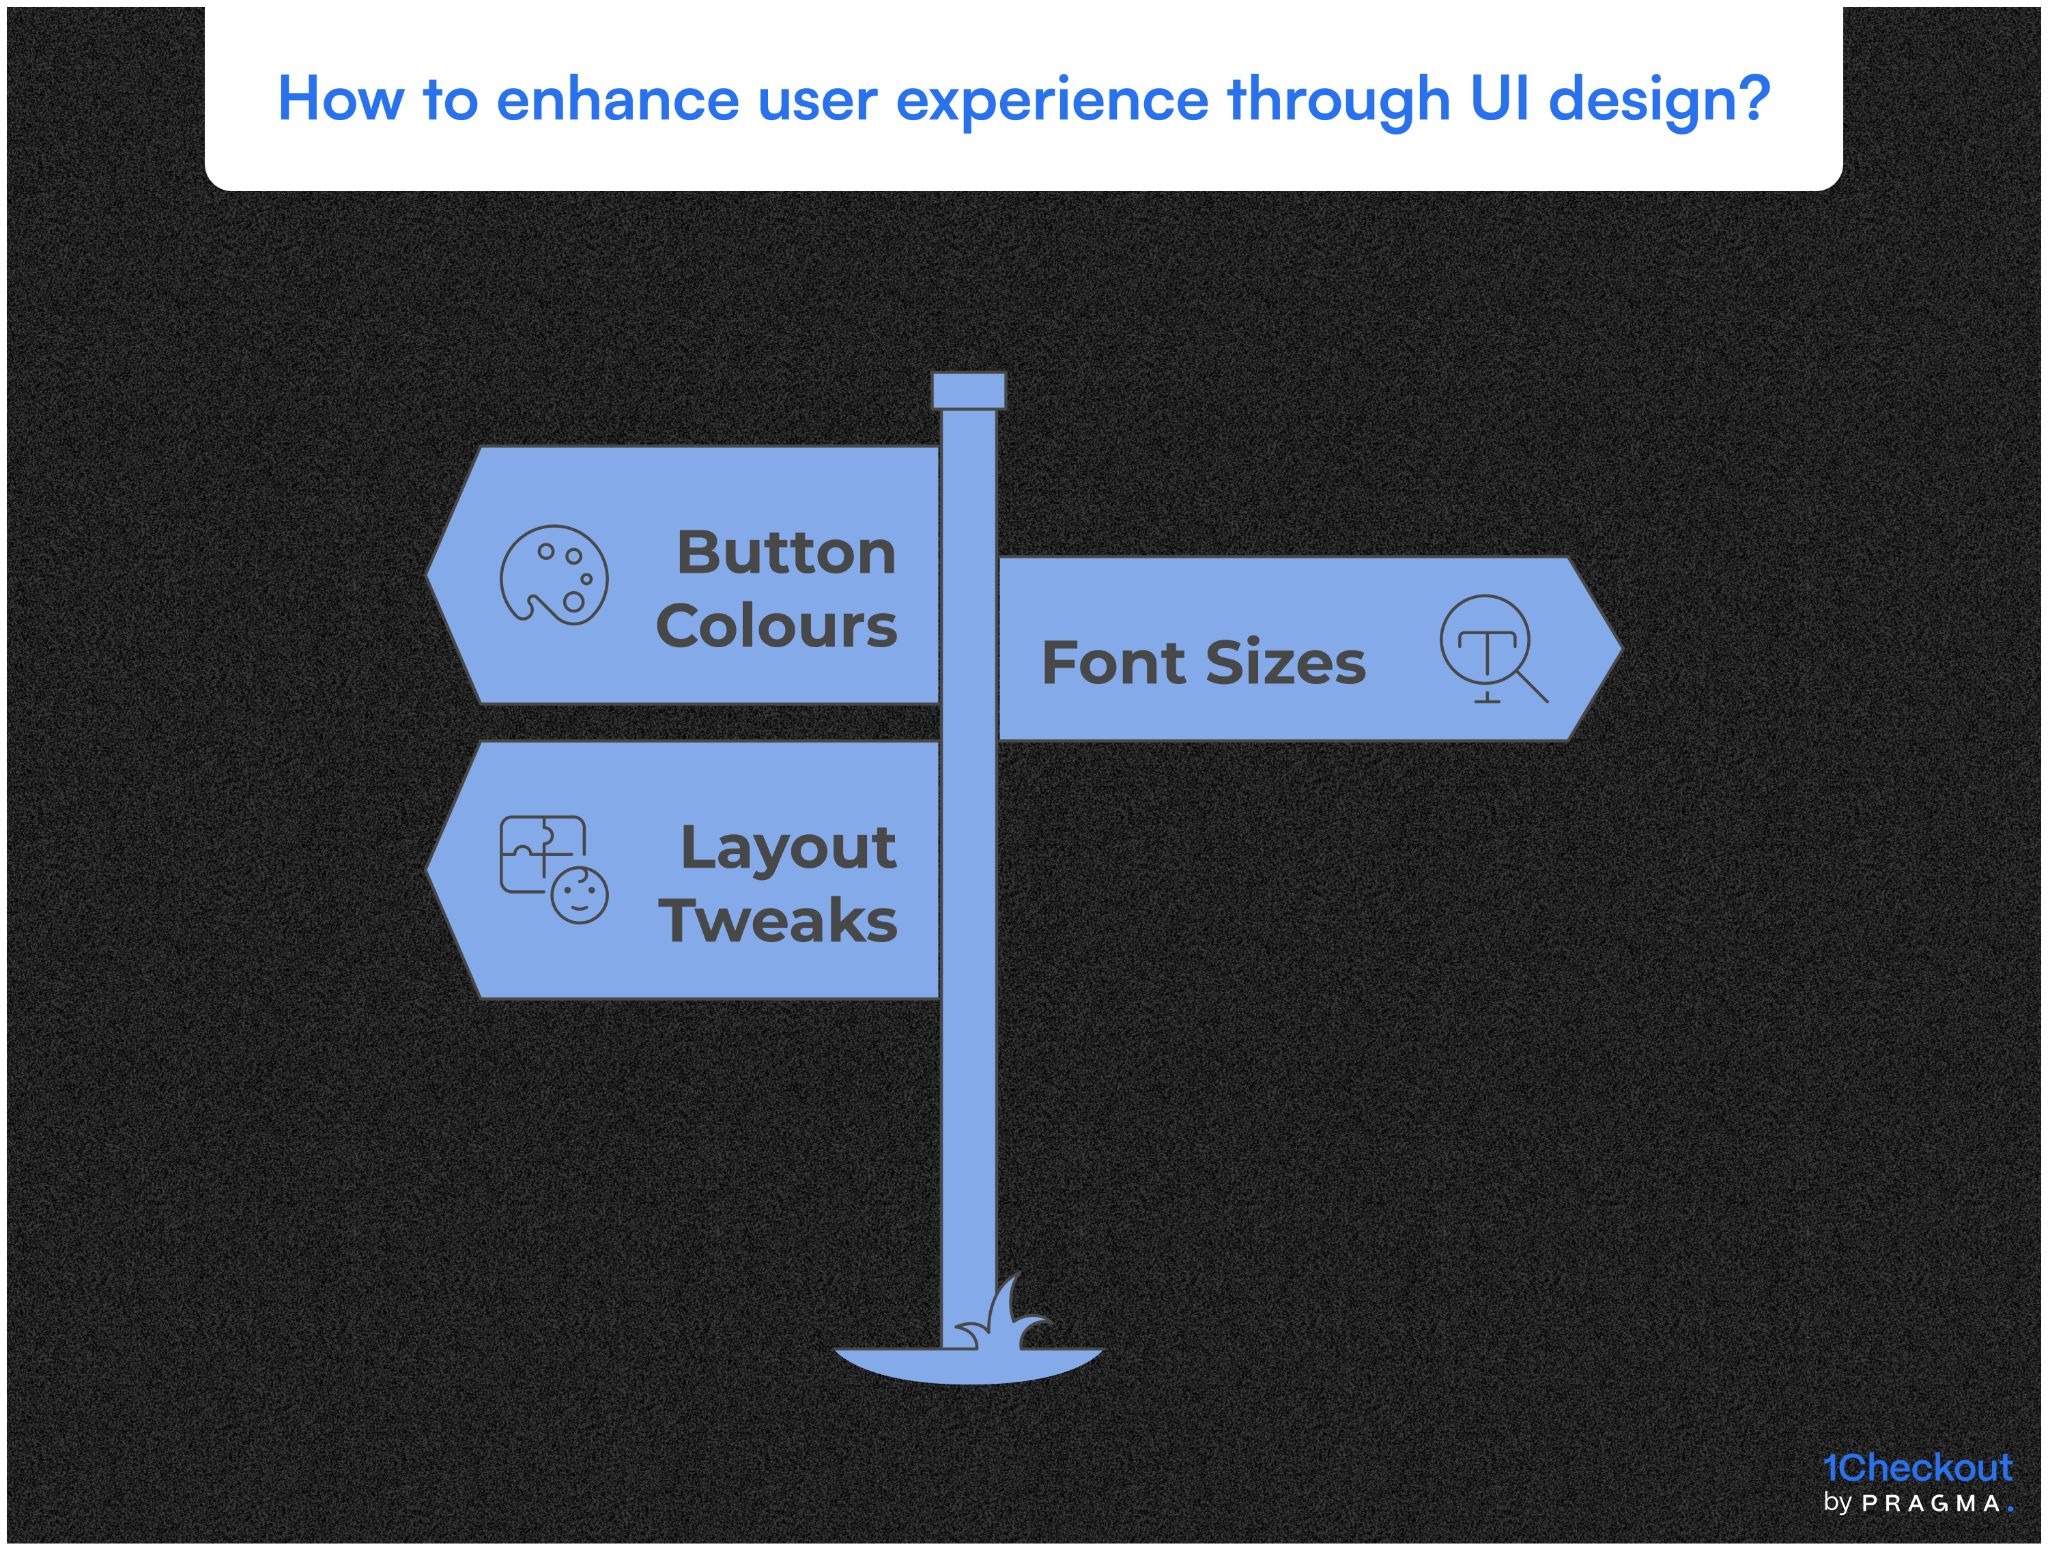
UX elements that influence conversion
Common checkout elements with high leverage include:
- CTA text and placement
- Form field layout and optionality
- Progress indicators and visual cues
- Payment options and default selection
Testing these systematically reveals which changes truly drive completion rather than subjective preference.
Operational impact
Even minor adjustments — like removing unnecessary fields or simplifying error messaging — can materially improve conversion, reduce support tickets, and improve payment success rates across regions with varying connectivity and device types.
Testing operational assumptions
Beyond UX, tests can target operational factors: inventory availability messaging, estimated delivery dates, or COD confirmation steps. These influence purchase confidence and perceived reliability.
Why this matters
Operational friction often goes unnoticed in traditional UX testing but can have outsized conversion impact, particularly in high-volume D2C contexts.
Implementing A/B tests safely across multiple regions
Scaling experiments requires regional and operational awareness
Accounting for regional variation
Customer behaviour can vary widely across cities, states, and languages in India. Payment preferences, mobile connectivity, and browsing habits all influence checkout performance. A test that performs well in one region may fail in another if these factors are ignored.
Operational approach to segmentation
Segment traffic by region, device type, and payment method to ensure balanced exposure. For example, allocating equal portions of users from Tier 1, Tier 2, and Tier 3 cities helps uncover geographically-specific trends while avoiding misleading aggregate results.
Timing and rollout considerations
Peak shopping periods, weekends, or festival campaigns can distort results. Experiments should be timed to avoid unusual behaviour spikes or adjusted for expected anomalies.
Example mitigation
Pause experiments during major sale events or apply control corrections to account for unusually high conversion surges that could mask real test impact.
How do you build a continuous experimentation culture?
Conversion uplift compounds only when testing becomes a habit
A/B testing is not a one-time initiative — it must evolve into a repeatable operating system.
Embedding experimentation into workflows
- Product teams define hypotheses during feature planning
- Marketing aligns campaigns with test variants
- Ops monitors downstream impact (returns, support, fulfilment)
This creates cross-functional accountability.
Creating a central experimentation log
Maintain a repository of:
- Hypotheses tested
- Results (win/loss/inconclusive)
- Segment-level insights
Over time, this becomes a decision-making asset, reducing repeated mistakes.
Incentivising learning, not just wins
Not every test will succeed — and that’s expected.
Teams should track:
- Learnings generated
- Invalidated assumptions
- Insights reused in future tests
Operational takeaway
Brands that treat experimentation as infrastructure — not a campaign — see consistent, compounding gains.
Tools and infrastructure needed for checkout experimentation
Execution quality depends on the underlying stack
Even the best framework fails without the right tools.
Core capabilities required
- Experimentation platform (for traffic splitting and tracking)
- Analytics tools (for funnel and segment analysis)
- Event tracking (for granular behaviour insights)
Integration considerations
Checkout experiments must integrate with:
- Payment gateways
- Order management systems
- Customer support tools
This ensures that secondary impacts are visible, not hidden.
Build vs buy decision
- Early-stage brands can rely on third-party tools
- Larger brands often build in-house systems for control and flexibility
Operational takeaway
Tooling should enable speed without compromising measurement accuracy.
Leveraging data for actionable insights
Tests are only valuable if the results translate into decisions
Statistical significance vs practical significance
While p-values and confidence intervals provide statistical validity, teams must also evaluate whether detected differences are operationally meaningful. A 0.2% uplift may be statistically significant but too small to justify full rollout.
Operational decision framework
Define minimum detectable effect (MDE) before running the test. Only changes that exceed the MDE and do not introduce friction for critical segments should be considered for deployment.
Monitoring secondary outcomes
Monitor metrics beyond conversion, such as:
- Payment success
- Form error rates
- Support tickets
This ensures that improvements in one area do not degrade other operational KPIs.
Example insight
A button copy change might increase checkout completions but also increase payment errors due to confusion — spotting this early prevents larger-scale negative outcomes.
Example A/B test framework for checkout
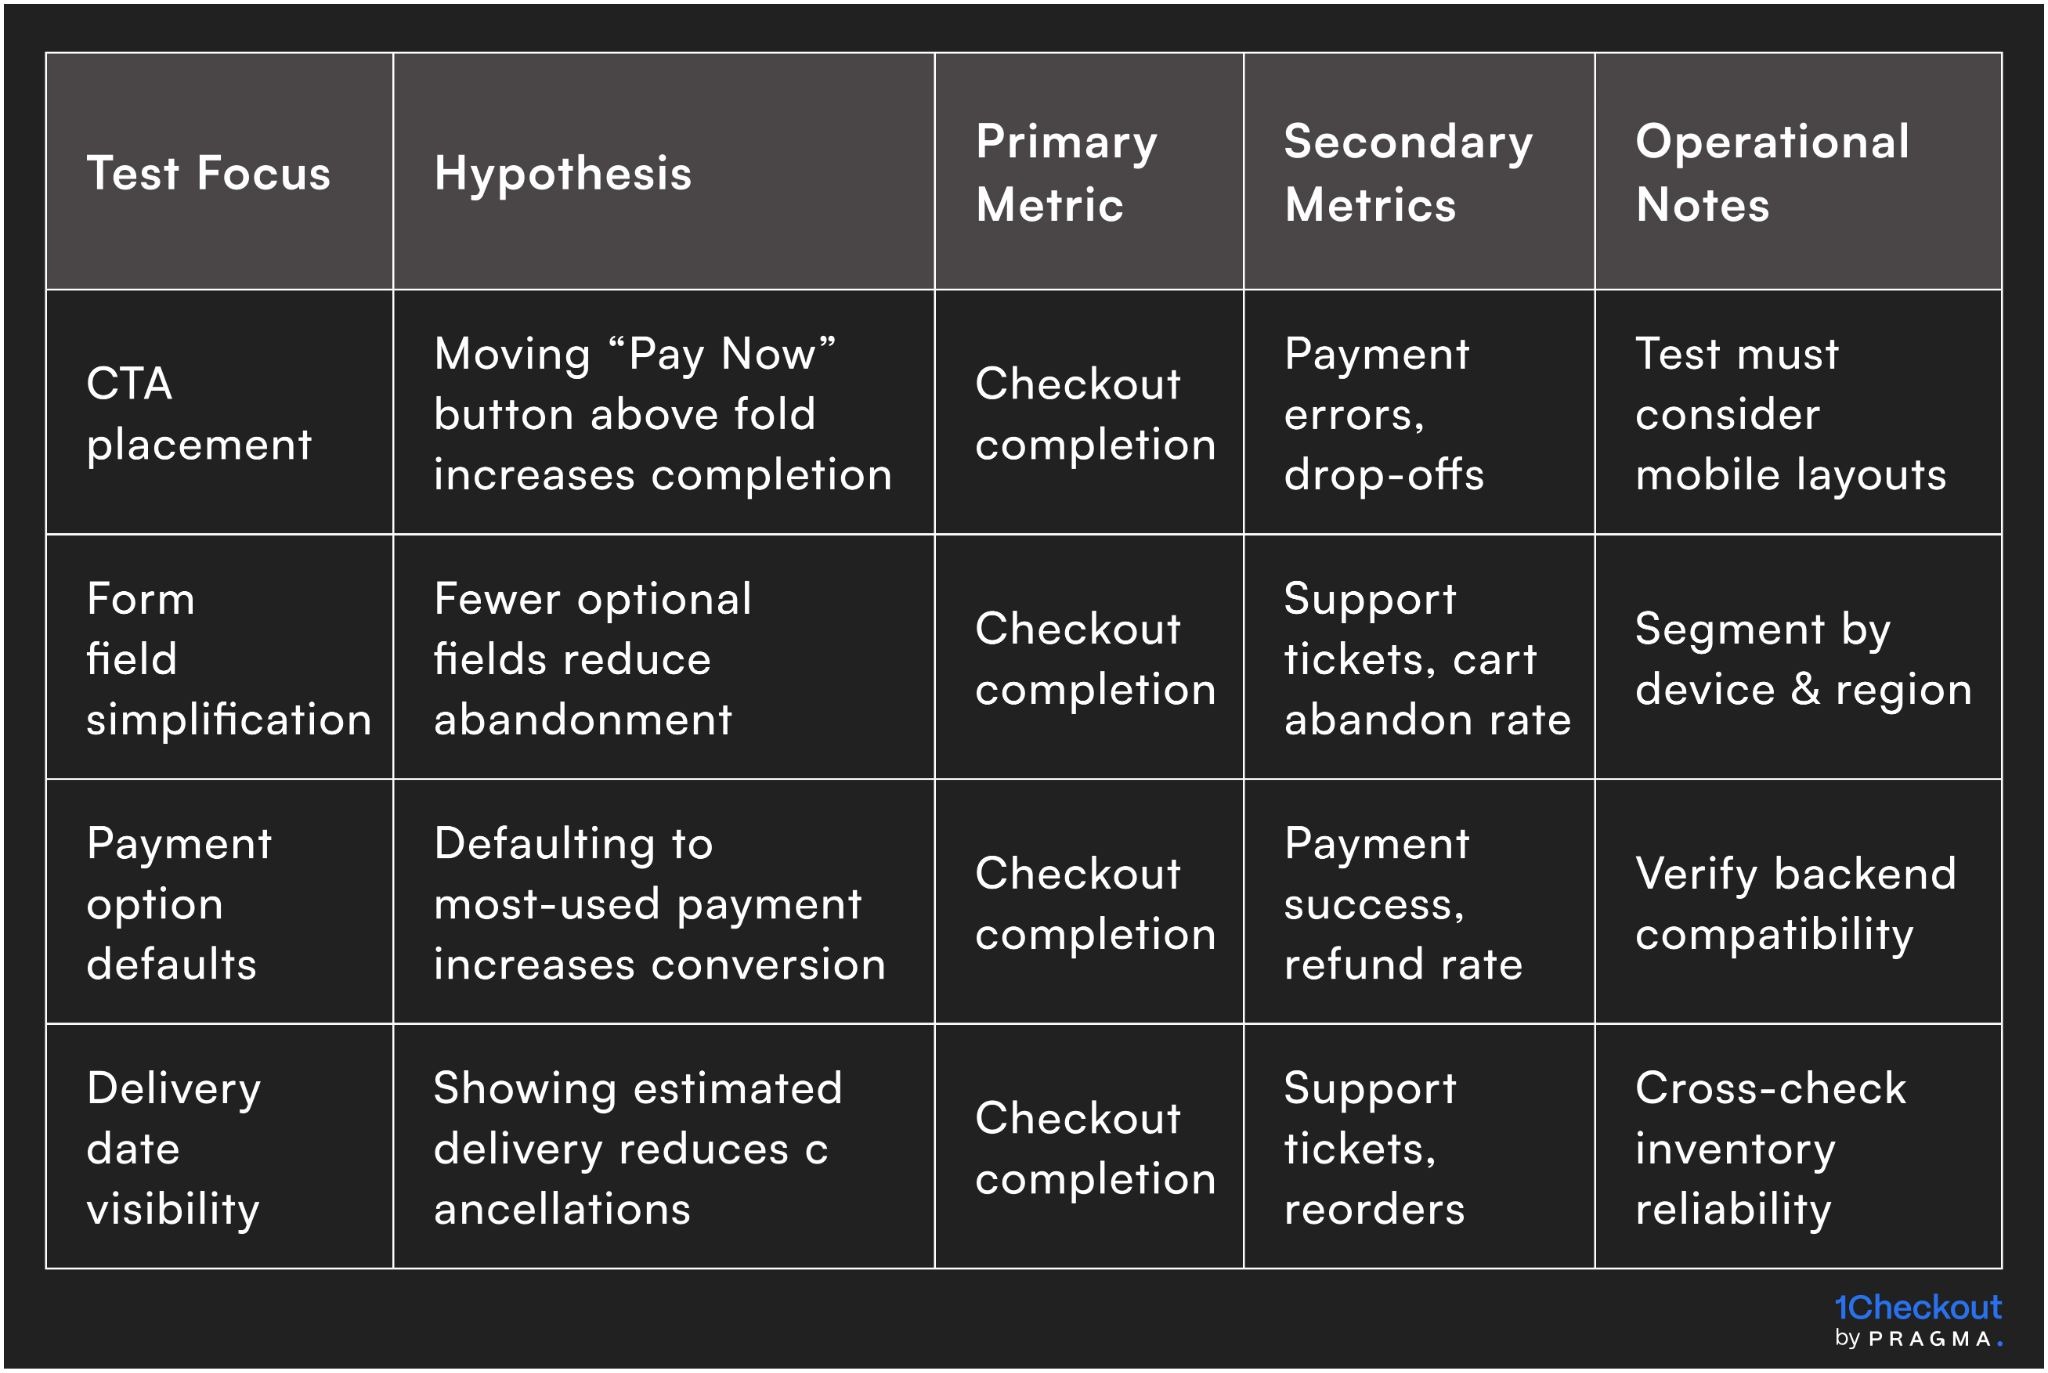
How do you scale winning experiments across the business?
The real value of testing comes from rollout, not just insight
A winning variant is only valuable when implemented correctly.
Gradual rollout strategy
Instead of full deployment:
- Start with 10–20% traffic
- Monitor for anomalies
- Scale progressively
This reduces risk.
Cross-segment validation
Before scaling:
- Validate across regions
- Check device-specific performance
- Ensure payment success consistency
Documenting and standardising wins
Successful experiments should translate into:
- Design guidelines
- Checkout best practices
- Default product decisions
Operational takeaway
Scaling is where experimentation turns into measurable revenue impact.
Quick wins on running checkout experiments
Immediate actions that yield insights within 30 days
Week 1 – Audit current checkout flows
Map every step, variation, and device experience. Identify friction points and define hypotheses for testing.
Week 2 – Launch 1–2 low-risk experiments
Target simple UX or copy changes with measurable outcomes. Ensure proper traffic allocation and segmentation.
Week 3 – Review metrics and monitor operational impact
Check both primary conversion metrics and secondary operational signals. Stop or adjust tests that introduce errors or complaints.
Week 4 – Scale winning variants
Roll out successful tests gradually, maintaining monitoring and ensuring no regional or device-specific regressions. Document insights for future tests.
Metrics to track for checkout experiment success
Measuring the right KPIs ensures experiments translate into real conversion uplift
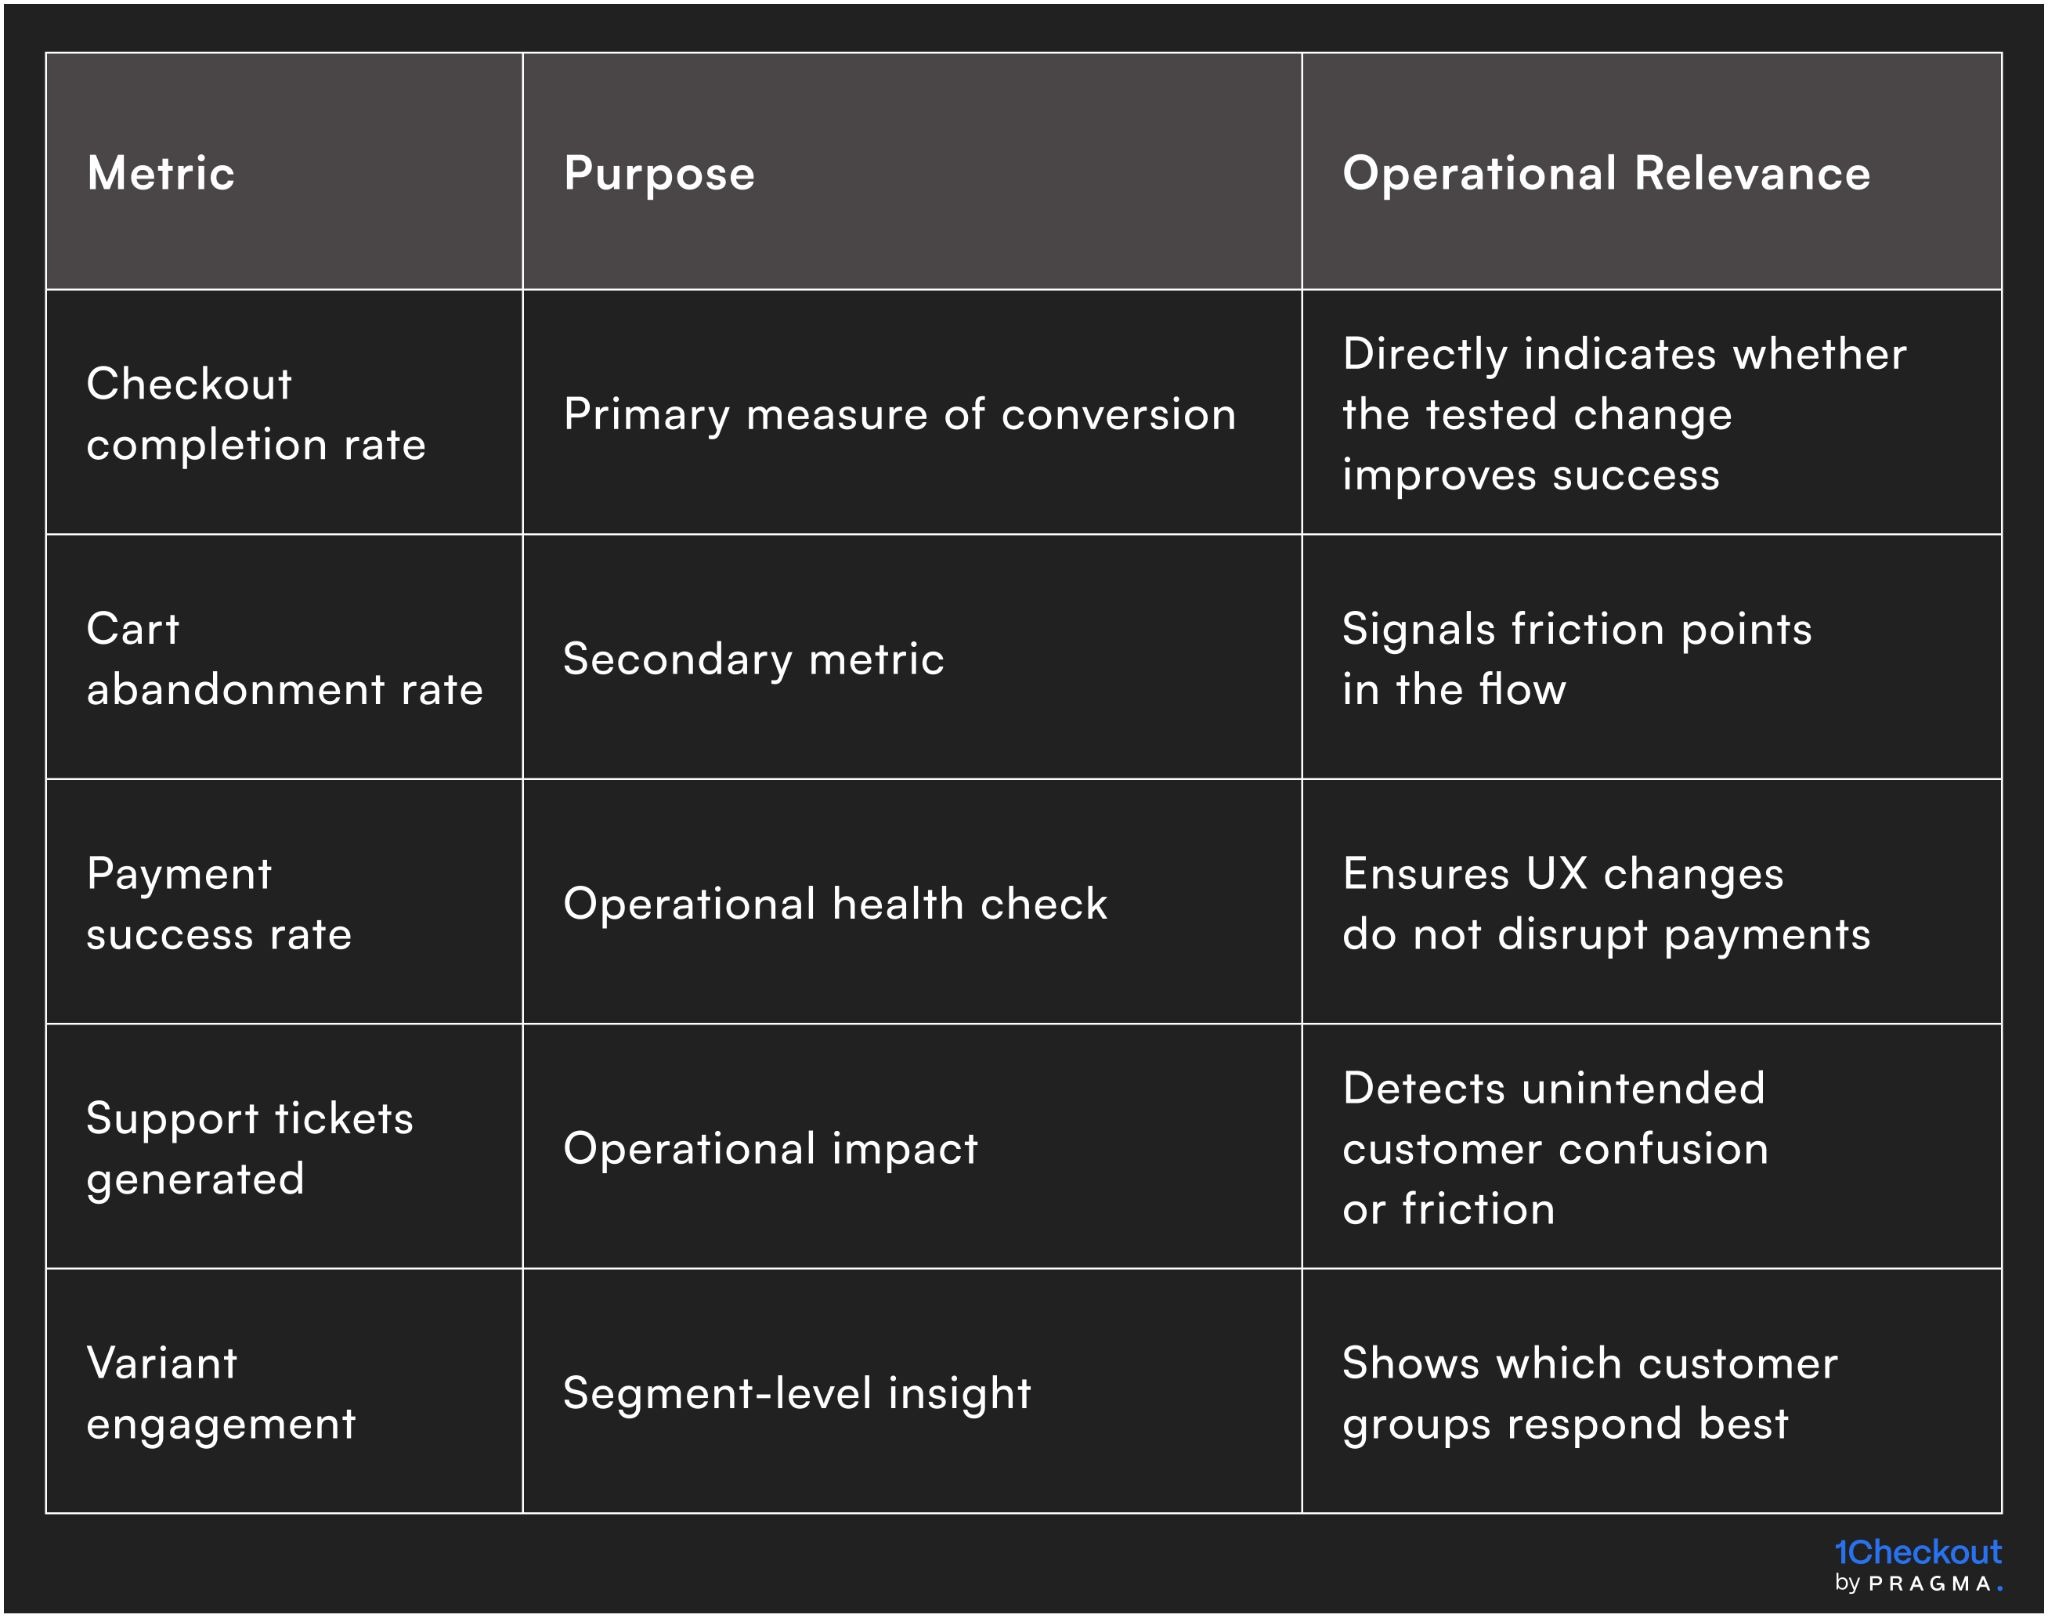
Tracking both primary conversion metrics and secondary operational indicators ensures that improvements are genuine and sustainable across regions, devices, and payment methods.
To Wrap It Up
Structured checkout experiments are the engine for sustainable conversion growth. They shift optimisation from opinion-driven tweaks to data-driven, repeatable improvements.
This week, audit your checkout flow and define at least two testable hypotheses for immediate experimentation.
Long-term, embed A/B testing into standard operational workflows, monitor both conversion and operational metrics, and document insights to scale learnings across products, regions, and campaigns.
For D2C brands seeking structured conversion optimisation, Pragma’s experimentation platform provides workflow governance, real-time metrics, and experiment tracking that help brands reliably increase checkout conversions and reduce operational risk.
.gif)
FAQs (Frequently Asked Questions On Checkout experiments: a step-by-step A/B testing framework for conversion uplift)
1. How do I decide which checkout elements to test first?
Prioritise changes that touch high-friction areas, affect large portions of traffic, or influence payment success. UX and operational impact should guide selection.
2. What is the minimum sample size for a reliable A/B test?
Sample size depends on baseline conversion, expected uplift, and confidence level. Calculate MDE (minimum detectable effect) before launching.
3. Should experiments be run across all regions simultaneously?
Not necessarily. Regional behaviour can vary; consider segmenting traffic to detect regional differences without contaminating results.
4. How long should each test run?
Run long enough to achieve statistical significance while accounting for traffic fluctuations. Typically 1–2 business cycles is sufficient, adjusted for traffic volume.
5. How do we prevent operational errors during tests?
Monitor secondary metrics like payment success, support tickets, and cart abandonment to catch unintended consequences early.


